

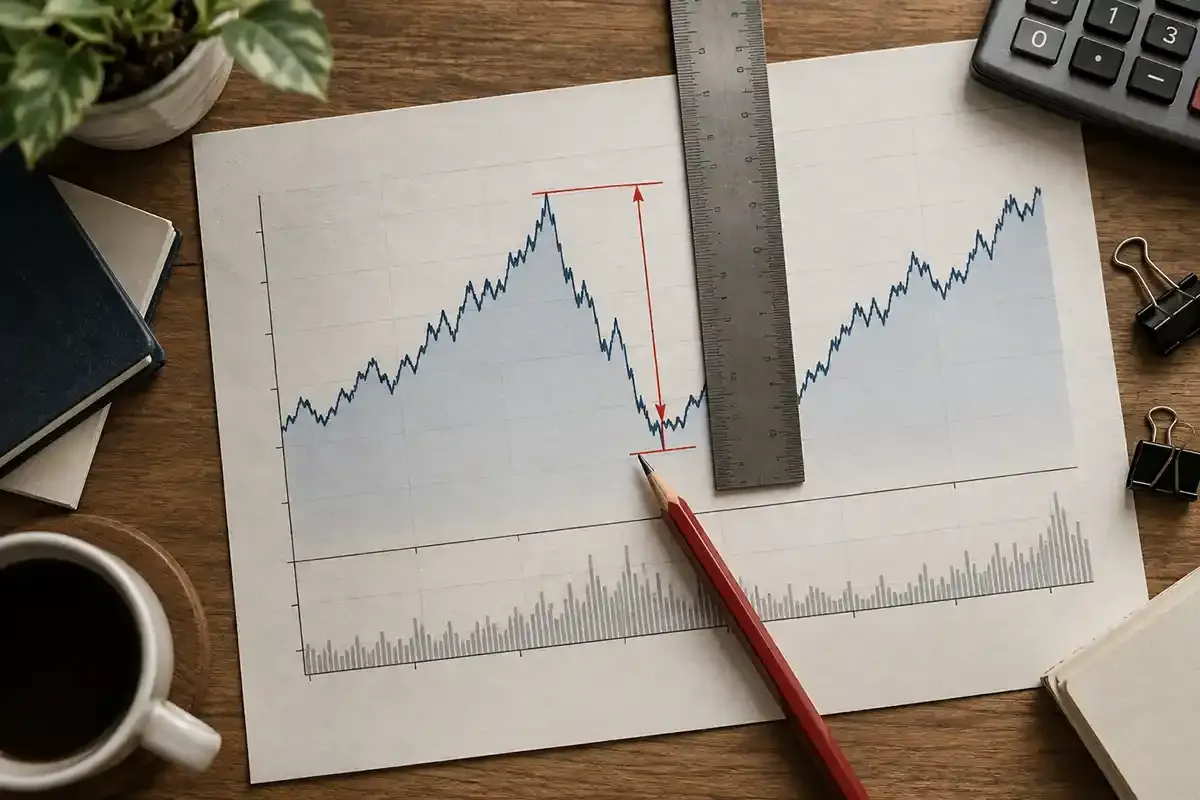

Maximum drawdown is one of the most useful risk measures on a copy-trading profile, but it is also easy to overread. It describes the largest decline already observed between a high point and a later low point. It does not state the worst loss that can happen next.
What maximum drawdown measures
Start with a balance or equity series over a defined period. Each new high is a peak. The decline from that peak to the lowest point before a new high is a drawdown. Maximum drawdown is the largest of those declines, normally shown as an amount, a percentage or both.
A simple example
If equity rises from 10,000 to 12,000, falls to 9,000 and later recovers, the peak-to-trough decline is 3,000, or 25% of the 12,000 peak. The calculation describes that path. It does not say whether the positions were closed at the trough or how long recovery took.
Balance versus equity drawdown
Balance changes when transactions are realised or cash moves. Equity also reflects the current value of open positions. A strategy that leaves losing positions open can therefore show modest balance drawdown while equity drawdown is much larger.
When a provider profile displays drawdown, identify which series and method it uses. Compare the visible curve, open-position exposure and account history rather than relying on one headline percentage.
Why observation periods matter
A three-month record and a three-year record do not contain the same range of conditions. A recently started strategy may not have experienced a volatility shock, sustained trend reversal or liquidity disruption. Deposits and withdrawals can also change percentage measures if the methodology does not separate cash flows clearly.
Check the start date, gaps in activity, number of trades and whether the period includes both gains and losses. How to Read Copy-Trading Provider Metrics explains how to review the whole profile.
Drawdown and recovery
Depth, duration and path
Two strategies can report the same maximum drawdown but behave very differently. One may recover quickly after many small trades; another may remain below its peak for months. Review time to trough, time under water, the number of overlapping positions and whether losses were concentrated in one market event.
Recovery also requires a larger percentage gain than the preceding percentage loss. A 50% decline requires a 100% gain from the lower level to return to the original peak.
Using drawdown in provider comparison
Compare providers over similar periods and with consistent definitions. Relate drawdown to return, leverage, deposit load, concentration and trading frequency. An unusually smooth curve deserves investigation: it may reflect genuine lower variability, but it can also conceal short data, open losses or infrequent valuation.
Review Copy-Trading Allocation and Provider Diversification before deciding how a provider fits the wider account.
Drawdown is not a stop
A reported historical metric does not automatically control the account. A separate allocation limit, loss boundary or stop-copy instruction may be available, but gaps and fast markets can affect outcomes. Confirm the current RockCopy control and its treatment of open positions before relying on it.
A drawdown review checklist
- Identify the balance or equity basis.
- Record the period and data frequency.
- Check the peak, trough and recovery duration.
- Review open losses and exposure at the trough.
- Compare like-for-like definitions.
- Combine the metric with leverage and concentration.
- Set independent follower controls.
Maximum drawdown can make a risk path visible. It cannot predict the next path, guarantee recovery or prevent a follower account from losing more than the provider's past result.